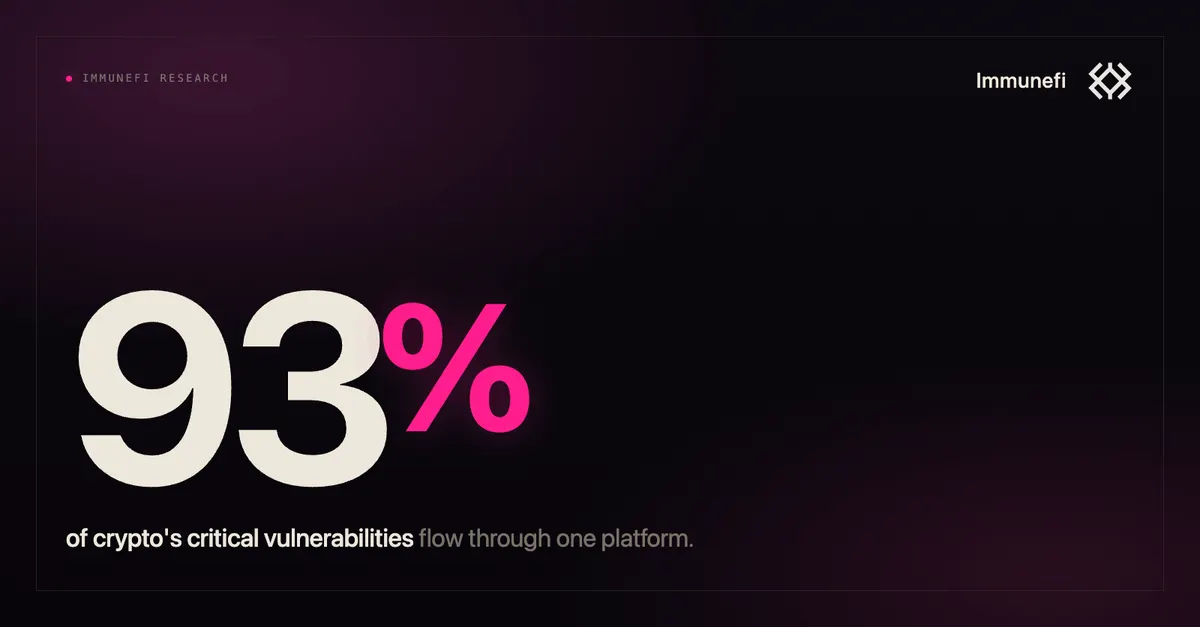
93% of Critical Crypto Vulns Are Disclosed on Immunefi.
An Immunefi research report on where post-launch critical vulnerabilities in the onchain economy actually get disclosed, and what the data says about industry-wide security.
Key findings
- Roughly 92.33% of post-launch critical vulnerabilities in crypto are disclosed through Immunefi, a concentration far steeper than platform reach would predict.
- Across all known platforms, ~1,238 critical vulnerabilities have been responsibly disclosed, against ~320 exploited onchain. The ratio is close to 4-to-1 in favor of responsible disclosure.
- Stripping out opsec-driven outliers, just 0.66% of TVL was lost to smart contract and blockchain bugs in 2025. That makes it the strongest year on record for code-level security.
- Platform size doesn't drive critical flow. HackerOne has orders of magnitude more registered researchers than Immunefi, yet captures a fraction of a percent of the disclosures.
Why this question matters
When a critical bug is found in production crypto code, where does that disclosure actually go? And once it lands somewhere, what happens to it?
The questions sound simple, but they haven't been answered cleanly in public. Over the past few years, the onchain security stack has matured into a layered system (pre-launch audits, audit competitions, and post-deployment bug bounty programs, or BBPs), and a handful of platforms now route most of the meaningful researcher activity. Nobody has shown what that routing actually looks like at the aggregate level.
This report attempts that map. As the leading bug bounty platform in web3, Immunefi has access to internal disclosure data with a level of granularity that isn't available elsewhere. Pairing that with conservative public-data estimates for competing platforms, it's possible to outline how critical vulnerability flow is distributed across the industry.
What follows is the resulting picture, the methodology behind it, and the implications for projects deploying code and researchers hunting bugs.
1. Where critical vulnerabilities end up
Start with the headline question: when a responsibly disclosed critical bug finds a home in crypto, which platform does it land on?
The distribution is dramatically lopsided. Around 92.33% of all post-launch critical vulnerabilities in crypto are disclosed via Immunefi.
Critical vulnerability disclosures by platform
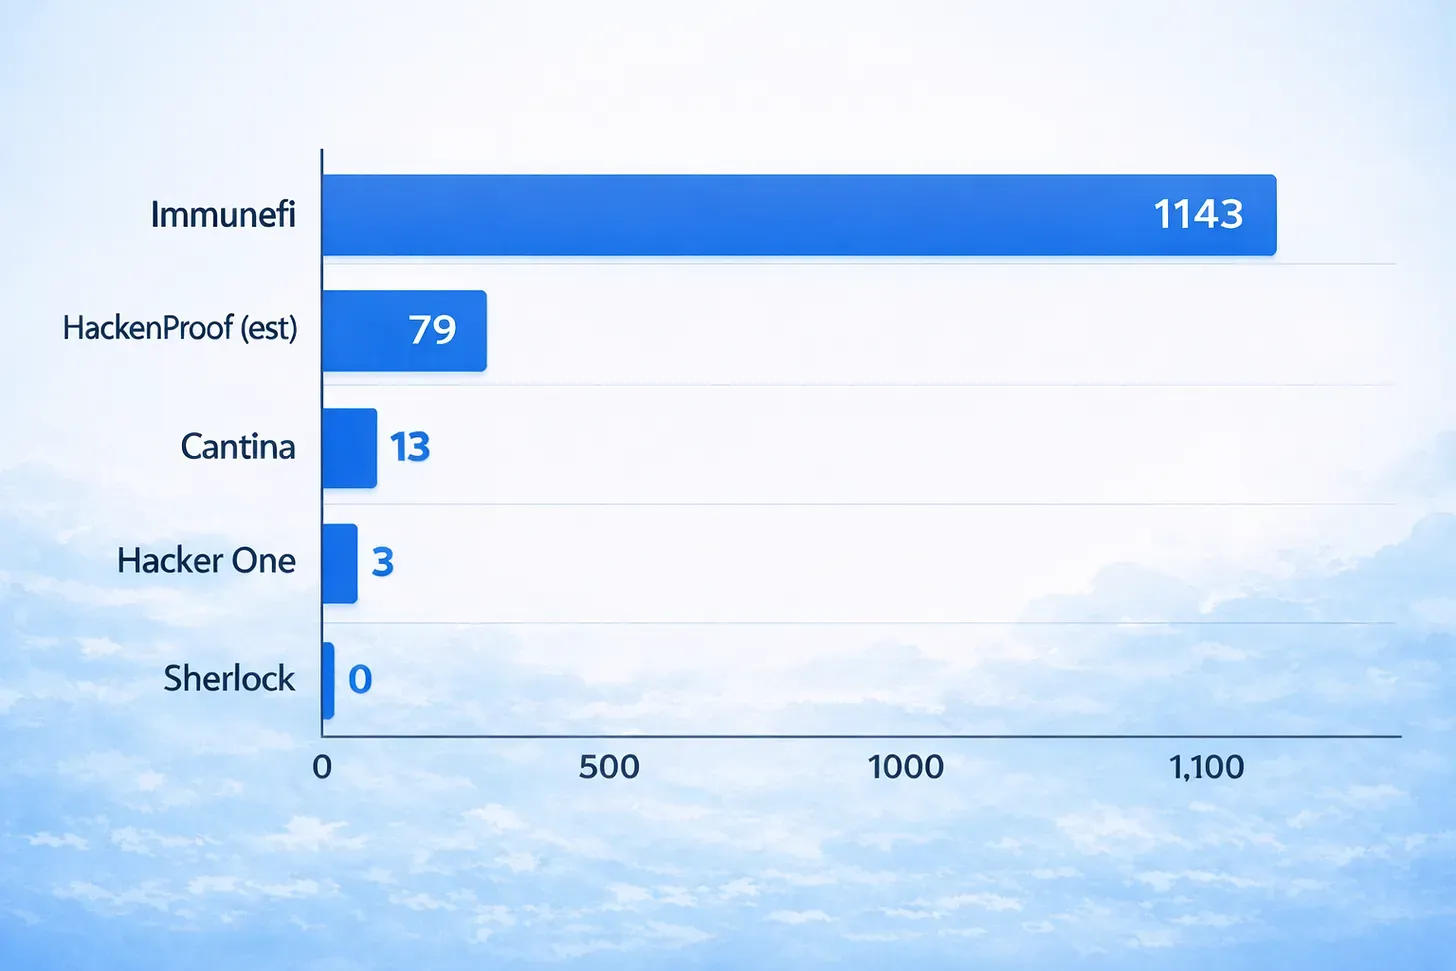
Source coverage: Immunefi figures span 2021 through early 2026. HackenProof estimates run from 2018 through 2026. HackerOne is limited to programs currently live. Cantina and Sherlock are measured from their respective BBP launches in 2024 through 2026.
The spread is hard to ignore. Immunefi sits 381x ahead of HackerOne and 87.9x ahead of Cantina. The closest competitor, HackenProof (the second-largest crypto-focused bug bounty platform), still trails by roughly 14.5x, and that comparison uses upper-bound assumptions favorable to HackenProof.
Critically, the gap isn't a function of audience size. Immunefi has roughly 60,000 registered researchers. HackenProof reports around 45,000. HackerOne's general user base is in the millions. Despite not having the largest researcher community, Immunefi captures the overwhelming majority of critical flow.
Output is wildly disproportionate to reach. That points to a selection effect: the researchers capable of surfacing critical bugs are deliberately routing those submissions through Immunefi rather than alternatives. What drives that researcher behavior is a question worth a dedicated piece, but the pattern itself is unambiguous in the data.
2. How the numbers were assembled
BBPs are only as auditable as the platforms running them, so it's worth separating the figures that are directly measured from the ones that required inference.
Directly measured (Immunefi internal data)
- 7,695 confirmed BBP reports (audit competition submissions excluded)
- 1,143 confirmed BBP criticals scoped to blockchain and smart contract assets
- ~14.9% critical rate across valid BBP submissions
Estimated (competitor platforms, from public sources)
HackenProof. HackenProof's model splits programs into multiple asset-specific listings, which has the effect of inflating the apparent program count. The majority show modest reward totals and limited activity. Narrowing to blockchain and smart contract programs where cumulative payouts exceed the listed minimum critical bounty leaves just 16 qualifying programs. Even applying the most generous interpretation (assuming every dollar paid out was a minimum-reward critical) produces an upper bound of 79 critical payouts across HackenProof's eight years of operation. That ceiling is the figure used here.
Cantina. The 13 critical reports attributed to Cantina come from their own public leaderboard. By Cantina's model, criticals are exclusively BBP submissions; their broader report volume is overwhelmingly audit-competition output, which falls outside the scope of this comparison.
Sherlock. Sherlock currently hosts 27 BBPs but publishes no critical report data and provides no statistical transparency. Sherlock's insurance product would automatically trigger a $500,000 payout in the event of a disclosed critical, and no such payout has ever been publicly reported. Supplemental research, including AI-assisted searches, turned up no known criticals either. Until evidence suggests otherwise, the working assumption is that Sherlock has not received a critical disclosure.
HackerOne. Six web3 BBPs are currently live on HackerOne, with three critical submissions on record across all of them. All three are on Coinbase's program, and all three are classified as Business Logic criticals rather than smart contract issues. They are included here for completeness given their severity. HackerOne's overall user base is vast, but its blockchain BBP traction is minimal. Earlier disclosure activity on HackerOne almost certainly existed pre-Immunefi, but historical and archived programs aren't publicly viewable, so they can't be counted.
Caveats and limitations
- Competitor figures rely on publicly observable signals, not direct reporting from the platforms in question.
- Disclosures made directly to a project, outside any platform, aren't captured. Self-managed bug bounty programs are well-documented as less effective than platform-mediated ones, and these reports are almost certainly a minority of total valid disclosures. They leave no observable trail and can't be estimated with any rigor.
- Loss figures are limited to incidents that were publicly reported.
- TVL serves as a proxy for value at risk, but real exposure is likely higher once the indirect impact of exploits on protocols, tokens, and ecosystems is accounted for. See The Real Impact of an Onchain Hack.
These caveats don't alter the broader shape of the findings. Should additional disclosure data become public after this report goes live, the analysis will be revised accordingly.
3. Disclosed vs. exploited
Critical vulnerabilities in production code resolve in one of three ways: a researcher reports them through a BBP, an internal team finds and patches them quietly, or an attacker exploits them. The middle category is opaque by design, but the other two can be measured.
Critical vulnerability outcomes
| Outcome | Count | Notes |
|---|---|---|
| Responsibly disclosed via BBP | ~1,238 | Aggregated across all known platforms |
| Exploited onchain by attackers | ~320 | Smart contract and protocol logic only |
| Cumulative onchain exploit losses | ~$6.75B | USD |
The disclosed-to-exploited ratio sits at approximately 4-to-1. Four critical bugs caught and reported responsibly for every one that reached attackers and caused onchain damage. That's the measurable yield of the post-launch security layer, and it's substantial.
The exploited-vulnerabilities figure is deliberately scoped. It only includes onchain exploits driven by code-level issues: protocol logic flaws, ecosystem-level attacks, and smart contract language vulnerabilities, the categories that better audits or more aggressive bug bounties could realistically have caught. Out of scope: private key theft, social engineering, and other infrastructure compromises, as well as rugpulls. These aren't code vulnerabilities, and a BBP couldn't have prevented them.
4. Is the onchain economy actually getting safer?
Disclosure flow is one signal. The deeper question is whether the industry's overall security posture is improving. To get at that, Immunefi looked at annual hack losses as a percentage of average TVL, a loss rate that reflects how much secured value gets stolen each year. TVL data is sourced from DefiLlama.
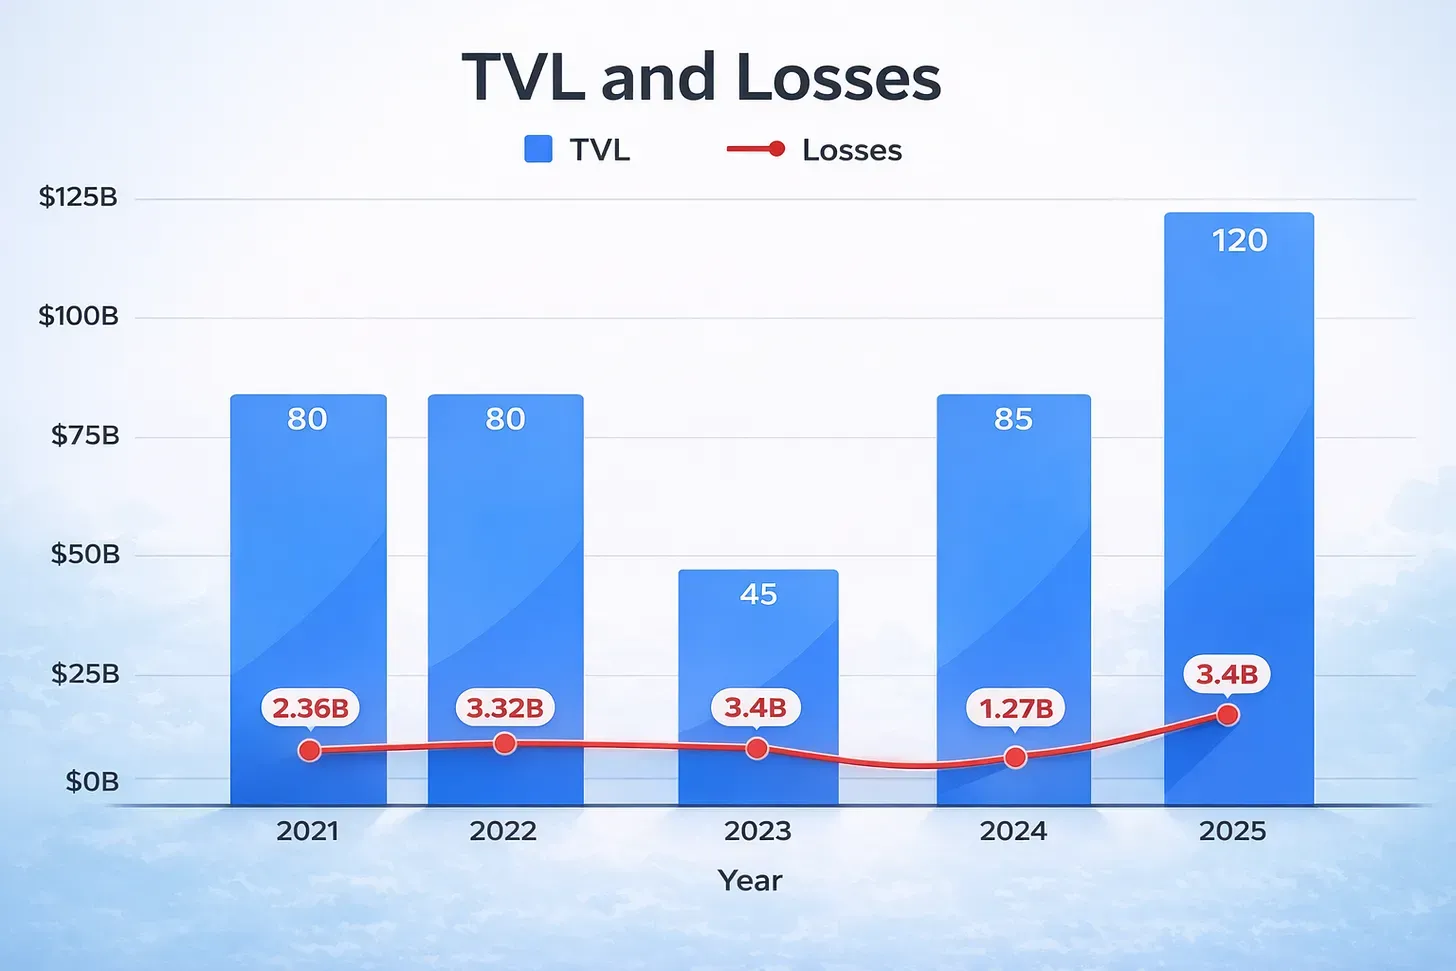
Annual onchain loss rate (5-year view)
| Year | Losses (USD) | Loss rate vs. TVL | Context |
|---|---|---|---|
| 2022 | Record high | Highest on record | Terra collapse, Ronin, Nomad, FTX-related fallout |
| 2023 | Elevated | Improving | Industry consolidates around stronger security practices |
| 2024 | $1.27B | 1.5% | Lowest since 2020; a 64% drop from the 2022 peak |
| 2025 | $3.4B | 2.8% headline | Inflated by personal and exchange wallet compromises |
| 2025* | ~$790M | 0.66% | Adjusted view, code-level risk only |
*2025 adjusted: excludes a cluster of large personal wallet compromises and a single $1.5B exchange wallet breach, which reflect operational security failures rather than smart contract risk.
What the trend actually shows
2022 was the worst year for onchain security on record, both in absolute dollar losses and as a percentage of TVL. The conditions were uniquely bad: the Terra collapse, the Ronin bridge, Nomad, and the cascading effects of the FTX implosion all converged.
2024 reversed that trajectory. TVL climbed back toward all-time highs, peaking near $130B in December, while losses fell to $1.27B, the lowest figure since 2020. As a share of value secured, that's a 1.5% loss rate, cutting the 2022 peak by roughly two-thirds.
2025's headline numbers tell a more complicated story. Total losses rose to $3.4B and the headline loss rate climbed to 2.8%, but the increase is concentrated in non-code categories: large personal wallet compromises and a single exchange wallet hack that alone accounted for $1.5B. Once those operational-security outliers are removed, the residual code-level loss for 2025 is approximately $790M, a 0.66% loss rate. The trendline in blockchain code security remains decisively positive; a single infrastructure breach doesn't change it.
Exchange and custody security is the obvious open problem. The 2025 incidents make clear that operational practices around key management and internal signing haven't scaled with the value now under custody. That gap is one of the more consequential challenges the industry needs to close as stakes continue to climb.
But measured strictly on the security of blockchain code itself, 2025 is the strongest year the industry has ever posted, with only 0.66% of TVL lost to smart contract and blockchain vulnerabilities.
5. Implications for projects and researchers
1. Platform choice determines program visibility.
If ~92.33% of critical disclosures move through Immunefi, then a bug bounty program hosted elsewhere is effectively invisible to the population of researchers most capable of finding serious bugs. This isn't a vendor preference question. It's a question of which researchers can actually engage with a given program. The reasons researchers consistently gravitate toward Immunefi deserve their own analysis; that's coming.
2. Continuous coverage isn't an optional layer.
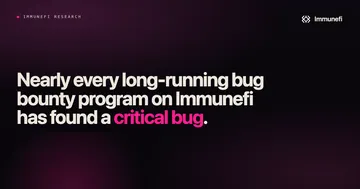
More than 80% of Immunefi customers have received critical vulnerability disclosures through their Immunefi BBP. Pre-launch audits remain essential, but they don't replace ongoing post-launch coverage. Shipping production code without a continuous bug bounty program leaves a protocol depending on luck, which isn't a tenable strategy for any system custodying user funds.
3. The macro security picture is improving.
Despite high-profile incidents continuing to make headlines, the underlying loss rate is falling, TVL is rising, and the ratio of value protected to value lost keeps shifting in the right direction. Crypto security is far from a solved problem, but the trajectory is measurable and the direction is clear.
Closing thoughts
The findings here weren't predetermined. The analysis could just as easily have shown loss rates scaling with TVL, security efforts failing to keep pace, or an ecosystem patched together with informal coordination. None of that is what the data shows.
What it shows instead is real, measurable progress. Loss rates are declining. Responsible disclosure has consolidated around the platforms that work, with Immunefi handling more than 92% of that flow. The post-launch security infrastructure built up over the past several years is producing meaningful results for the onchain economy.
The future of the onchain economy is bright.
For questions about this study or Immunefi itself, reach out at press@immunefi.com
About Immunefi
Immunefi is the leading security platform for crypto, protecting more than $180 billion in user funds, and securing protocols across the full development lifecycle, from pre-deployment through production.