The Ecosystem Vulnerability Scoreboard: 6 Years of DeFi Loss Data
Immunefi maps six years of DeFi protocol losses across major ecosystems. Total losses fell 80% from 2022, but new multi-chain and custodial risks are emerging.
An Immunefi research report tracing exploit-driven DeFi protocol losses across major ecosystems from 2020 through 2025, with TVL-adjusted risk ratios and a look at where security is improving, where it is concentrating, and where the next wave of risk is forming.
Key findings
- Industry-wide DeFi protocol losses fell roughly 80% from the 2022 peak of $2.62 billion to $534 million in 2024. The 2025 figure rebounded to $680 million, but the increase traces back to a handful of large incidents rather than broad-based regression.
- Median loss per incident dropped from $6 million in 2022 to $1.5 million in 2025, a 75% decline, even as total DeFi TVL expanded substantially across ecosystems.
- Ecosystem-class attacks (flash-loan oracle manipulations, reentrancy exploits) collapsed from nearly 19% of DeFi losses in 2022 to under 1% in 2025. Bridge incidents fell from 73% of all losses in 2022 to 3% in 2025.
- Private key compromises are migrating, not declining. Inside DeFi protocols, key compromise losses fell to 8.1% in 2025. At the custodial layer, exchanges absorbed over $1.6 billion in infrastructure-class losses in 2025, led by the Bybit $1.5 billion multisig phishing exploit.
- On a TVL-adjusted basis, the safest tier among major ecosystems in 2025 is Ethereum (~0.42%), Solana (~0.42%), and BNB Chain (~0.33%). Scale and security are advancing together.
Crypto hacks are not random events
Crypto hacks do not happen at random. Some ecosystems are demonstrably safer, others demonstrably more dangerous. But raw dollar losses alone do not reveal which ecosystems are getting safer, which are deteriorating, or what is driving any of the underlying movement.
To get there, the analysis needs to look at DeFi protocol loss rates: exploit-driven losses tied to protocols actually operating inside an ecosystem, normalized against the scale of value those ecosystems secure over a given period.
Immunefi assessed exploit and vulnerability data across the major ecosystems for the 2020 through 2025 window. Six years captures the entire arc of DeFi security to date: the flash-loan-heavy beginnings of 2020, the breakneck growth and mega-exploits of 2021, the bridge meltdowns of 2022, the slow maturation of 2023, and the increasingly divergent paths of 2024 and 2025.
A note on scope. The focus is DeFi protocol losses, since those are the incidents that genuinely reveal the security posture of an onchain ecosystem. Centralized exchange failures that happened to hold assets on a given chain are deliberately separated out.
The distinction matters more than it might appear. When Bybit lost $1.5 billion to a multisig phishing exploit in February 2025, the stolen assets sat in Ethereum-based wallets, but the failure happened inside Bybit's custody and approval pipeline, not in Ethereum itself. The same logic applies to DMM Bitcoin's 2024 loss of $305 million, which was an exchange-level key management failure rather than a Bitcoin vulnerability. Folding those incidents into ecosystem-level security comparisons would distort the picture. For this report, exchange losses are kept distinct from protocol-level losses so the ecosystem read is clean.
Methodology: counting multi-chain incidents
The dataset is built around exploit-driven DeFi protocol losses. Centralized exchange failures are kept out of the ecosystem rankings (in practice, each exchange operates as its own self-contained ecosystem anyway). Fraud and rug pulls are also out of scope, except where historical context demands a mention.
Attribution rule. Where a single exploit hits multiple ecosystems, the full dollar loss is attributed to every affected ecosystem. A protocol deployed across six chains and exploited on all of them counted all six times, because participants on each of those chains were exposed to the full impact of the event.
The cost of doing it this way: summing ecosystem totals will overshoot the true industry-wide loss number, because multi-chain incidents get counted in every ecosystem they touched. Immunefi made this choice because it more accurately captures the risk an ecosystem's participants actually carried, even at the cost of overstating aggregate impact. Whenever a multi-chain event materially shapes a specific ecosystem's number, that influence is flagged explicitly in the analysis.
Losses are also normalized against each ecosystem's TVL (total value locked), sourced from DeFiLlama. Because TVL moves significantly month to month, the analysis uses approximate annual averages instead of point-in-time snapshots. The ratios should be interpreted directionally rather than as exact figures: a chain at a 0.4% loss-to-TVL ratio is meaningfully safer than one at 6%, but the precise decimal is a working estimate.
The industry-wide picture: DeFi is getting safer
The single most important finding in the dataset: DeFi protocol security has improved dramatically over six years.
Industry-wide DeFi protocol losses by year (unique incidents)
Unique incident counts; multi-chain exploits counted a single time regardless of how many networks they touched.
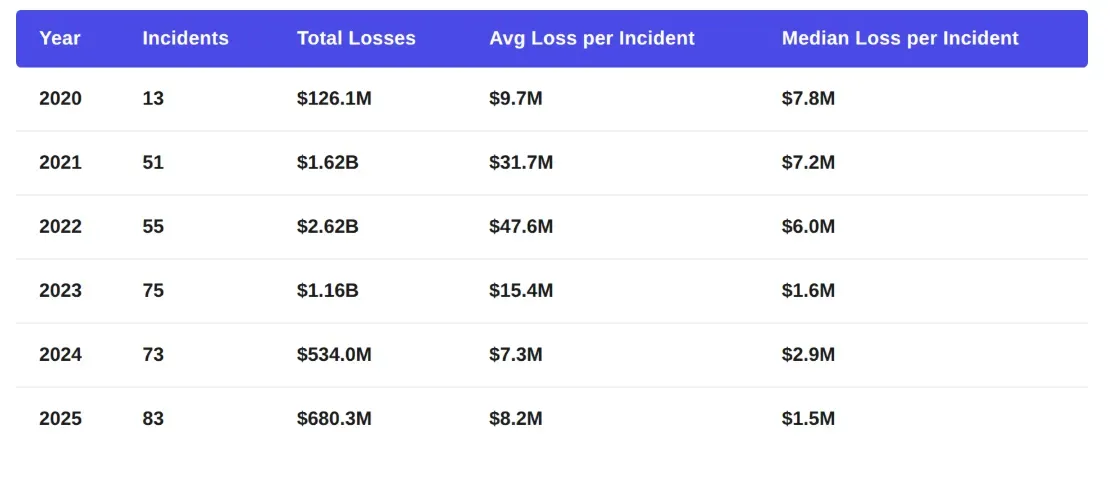
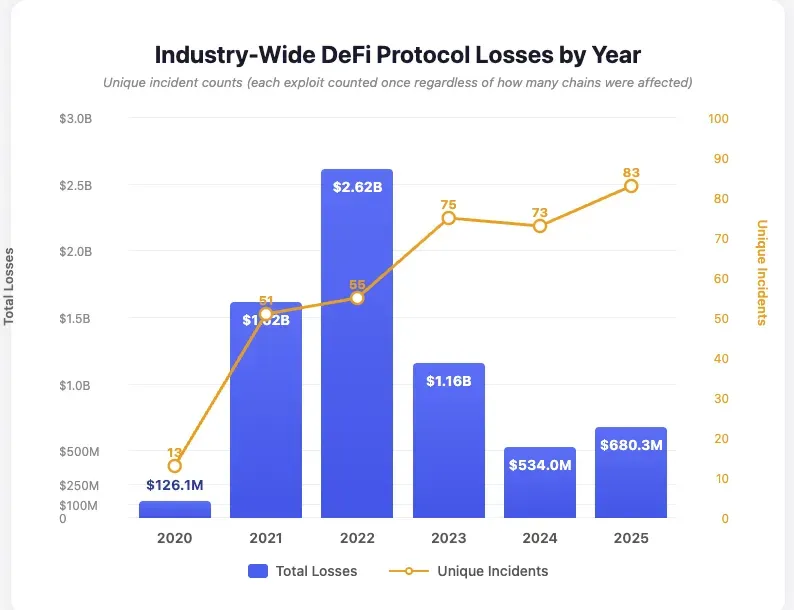
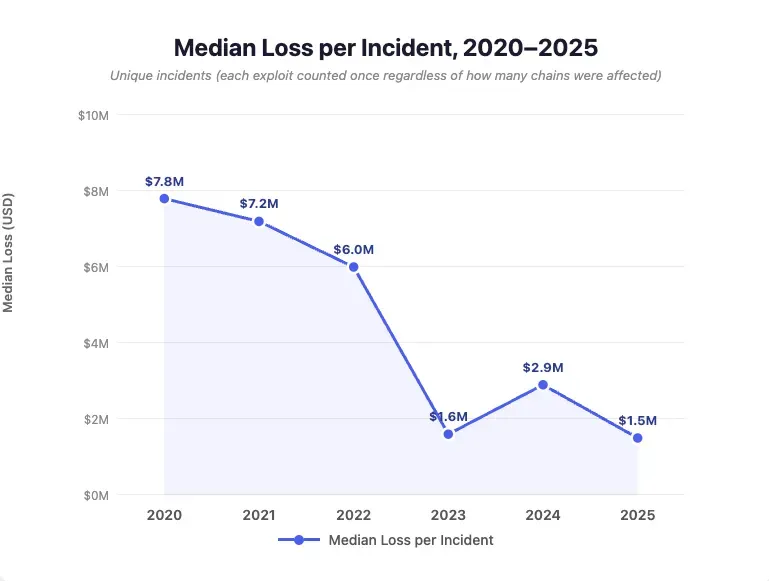
Starting from the 2022 peak of $2.62 billion, total DeFi protocol losses fell 80% to $534 million in 2024. The $680 million registered in 2025 represents a partial rebound, but almost all of that increase traces back to a handful of large events. A more revealing measure is median loss per incident, which dropped from $6 million in 2022 to $1.5 million in 2025, a 75% decline. The typical exploit is shrinking even as the number of incidents climbs, and even as DeFi TVL grows substantially across ecosystems.
The combination is the signal: rising TVL, a higher incident count, but lower median severity and lower total losses relative to value secured. That is the clearest available indication that DeFi's security posture is improving in aggregate.
How the threat landscape has changed
The categories of attack driving DeFi protocol losses have shifted substantially across the period. Mapping that shift is necessary to make sense of where onchain security currently sits and where it is heading.
Note: the classification figures in this section cover DeFi protocol incidents only. Exchange losses, including the custodial and key management failures flagged in the scope disclaimer, are not folded in here. Exchange-side threats took a very different trajectory in 2025, and that trajectory is addressed in its own section below.
Attack classification share of losses by year
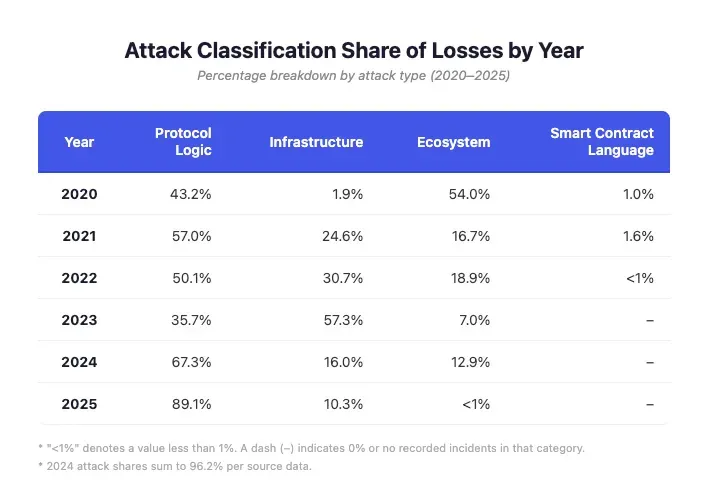
Two transitions are particularly striking. The first: ecosystem-class attacks (flash-loan oracle manipulations and reentrancy exploits hitting composability layers) contracted from roughly 19% of losses in 2022 to under 1% in 2025. The countermeasures targeting these patterns, including stronger oracle design, mature reentrancy guards, and improved composability primitives, are doing the work they were built to do.
The second: among DeFi protocols, infrastructure failures (private key compromises, database attacks, operational security breakdowns) fell from 30.7% of losses in 2022 to 10.3% in 2025. What is left inside the DeFi protocol category is increasingly protocol logic exploits: specific, often novel, code-level flaws in individual applications.
That trend does not generalize to the broader industry. Exchanges took over $1.6 billion in infrastructure-class losses in 2025 alone, with Bybit's $1.5 billion multisig phishing exploit at the top of the list. Once exchange losses are added back in, infrastructure failures remain the largest single loss category industry-wide. The DeFi protocol improvement is real, but it should not be confused with an industry-wide drop in operational security risk.
For DeFi protocols specifically, the shift signals a maturing security ecosystem. The repeatable, templated onchain attack patterns are getting closed off. What is left is harder work for attackers: hunting unique logic flaws inside individual protocols rather than reapplying known techniques across dozens of vulnerable targets. At the custodial layer, though, the oldest attack pattern in the book, going after the humans who hold the keys, reached unprecedented scale in 2025.
Bridge exploits: same risk, different form
Bridges defined the vulnerability landscape of 2021-2022. In 2022 alone, nine bridge exploits drove $1.9 billion in cumulative losses: Ronin Bridge ($624M), Binance Bridge ($570M), Portal/Wormhole ($326M), Nomad ($190M), Harmony Bridge ($100M), and Qubit ($80M).
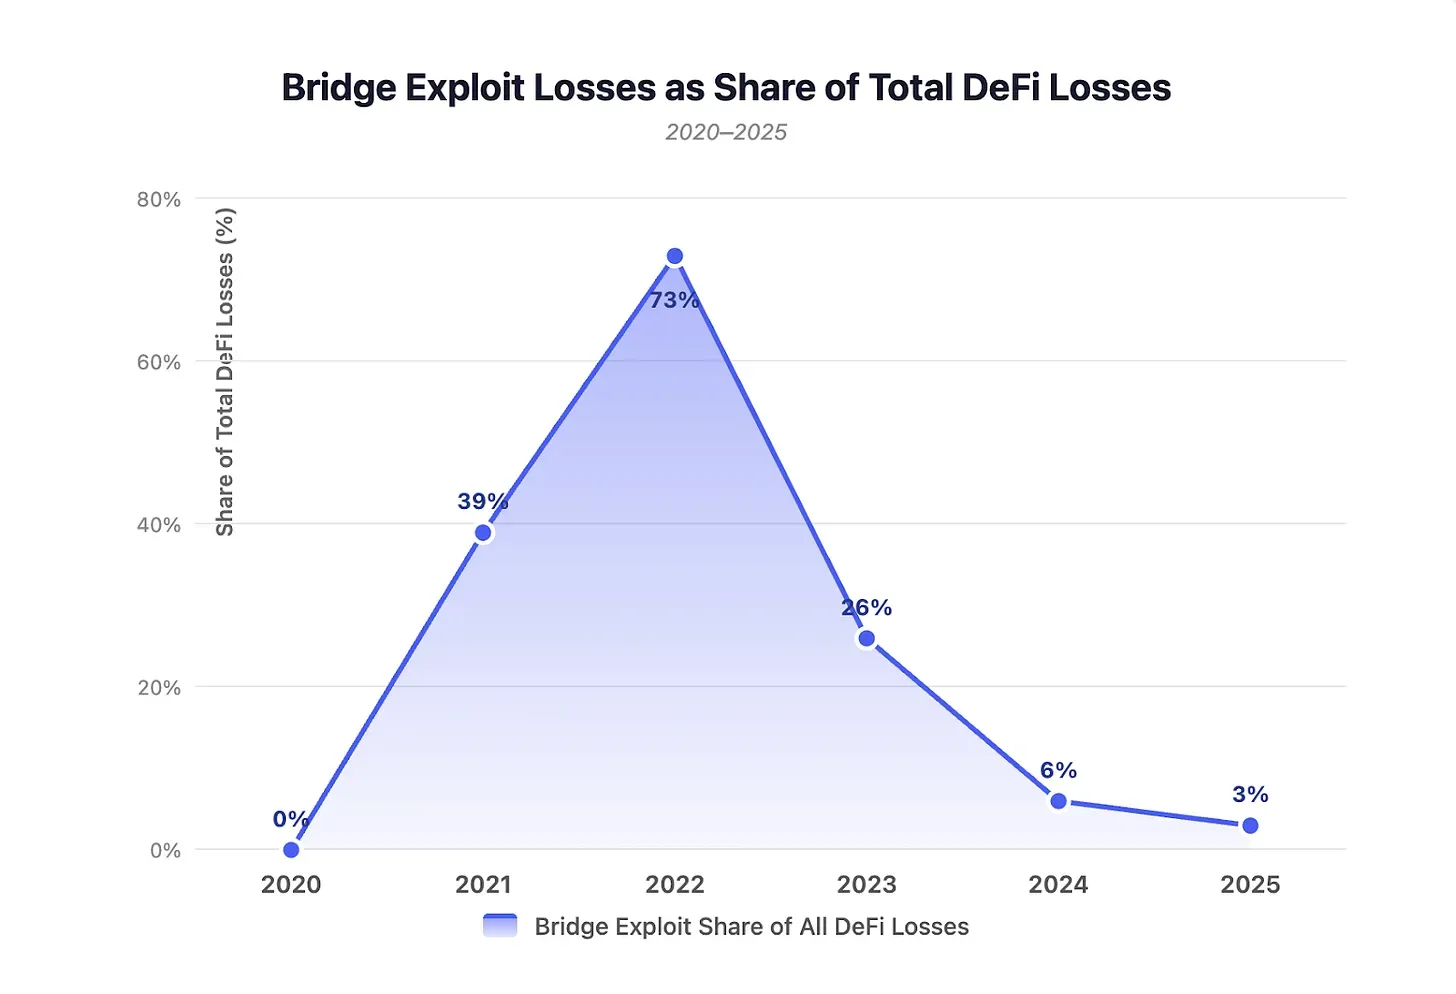
The drop-off is dramatic: from 73% of all losses in 2022 to 3% in 2025. The particular bridge architectures that broke in 2022, mostly centralized validator sets with thin multisig thresholds, have largely been retired or hardened.
What hasn't gone away is the underlying problem of cross-chain trust. It has simply changed form. The KelpDAO incident in April 2026 made the new shape concrete: attackers drained $292 million through a LayerZero-powered bridge configured with a single verifier, a single point of failure standing behind hundreds of millions in user assets. The exploit was attributed to North Korea's Lazarus Group, the same actor responsible for the Ronin Bridge hack four years earlier. The downstream contagion produced up to $230 million in bad debt on Aave and triggered $13 billion in DeFi TVL withdrawals within 48 hours.
The vulnerability itself was not exotic. At the moment of the exploit, 47% of applications running on LayerZero were using the same minimal verifier setup. Bridge risk did not decline. It moved out of purpose-built bridge protocols and into the cross-chain messaging layers that now sit beneath much of how DeFi moves assets across chains. The structural implications of that shift are taken up in the multi-chain exposure section below.
Flash loans: from dominant threat to marginal
Flash-loan attacks were the signature DeFi exploit pattern of 2020-2022. They drove 54% of all losses in 2020 and stayed a meaningful share through 2023. By 2025, flash-loan attacks accounted for under 1% of DeFi losses.
The collapse of flash-loan attacks as a major loss vector reflects genuine defensive progress: stronger oracle architectures (time-weighted average prices, Chainlink integration), reentrancy protections, and protocol designs that anticipate atomic manipulation as a baseline assumption.
Private key compromises: down in DeFi, up at the custodial layer
Within DeFi protocols, private key compromises were the leading single technique category in 2022 (28.7% of losses) and 2023 (32.2%). By 2025, they were down to 8.1% of DeFi protocol losses. DeFi teams losing keys is a smaller share of the dataset, and the dollar amounts on those incidents trend lower than before.
The picture diverges sharply once attention moves outside DeFi protocols. At the exchange and custodial layer, 2025 was the worst year on record for private key compromises. Bybit lost $1.5 billion to a multisig phishing exploit. Phemex took an $85 million loss, CoinDCX $44 million, and BtcTurk $48 million, all tied to key compromises in the same year.
The technique itself is not in retreat. It is relocating. Attackers have shifted target away from DeFi protocol teams, where key management practices have visibly tightened, toward centralized custodians where a single compromised signer can release dramatically larger sums. Risk has consolidated, not dissipated.
Multi-chain exposure: the emerging risk vector
One of the more consequential structural changes captured in the dataset is the rise of multi-chain exploits: incidents that propagate across multiple ecosystems because the same vulnerable code or trust assumption is replicated in more than one place.
In 2021, the multi-chain story was dominated by Poly Network, a bridge exploit. By 2025, the dominant multi-chain incident was Balancer V2's $128 million composable stable pools exploit, which hit Ethereum, Arbitrum, Base, Polygon, Sonic, and OP Mainnet at the same time. The flaw was in protocol logic rather than a bridge: anywhere the code was deployed, it was exploitable.
The implication is that ecosystems no longer function as cleanly separable security domains. The moment a chain becomes part of the standard deployment map for major protocols, it absorbs the risk surface of every protocol running on it. Multi-chain architecture, especially configurations that share code, signer paths, verification assumptions, or operational dependencies across networks, is increasingly worth treating as its own distinct risk class.
The ecosystem scoreboard
Every ecosystem participant, developers, LPs, end users, eventually arrives at the same question: which ecosystems are getting safer over time, and why? The full picture is below.
DeFi protocol losses by ecosystem, 2020-2025 (multi-chain incidents counted per chain)
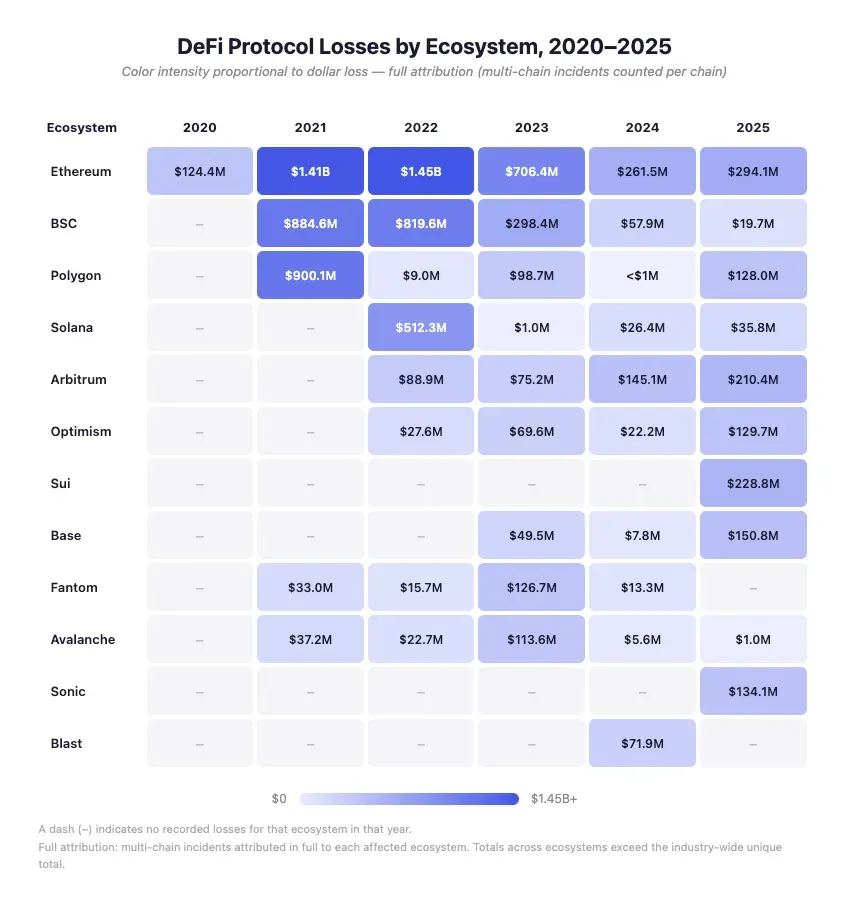
A few patterns surface. The oldest and largest ecosystems (Ethereum, BSC) show clearly improving loss profiles over the past few years, even though they still carry the heaviest cumulative damage. Newer, faster-growing ecosystems (Arbitrum, Base) trend in the opposite direction, with rising losses consistent with the familiar pattern of DeFi adoption running ahead of defensive maturity. And in several cases, multi-chain attribution dominates the 2025 figures: Polygon, OP Mainnet, Base, and Sonic all carry 2025 numbers shaped overwhelmingly by Balancer V2's cascade.
Loss-to-TVL ratios: the real risk measure
Raw dollar losses matter, but they ignore scale. A $50 million loss on a chain securing $50 billion is categorically different from a $50 million loss on a chain securing $500 million. To compare ecosystems on a like-for-like basis, the analysis normalizes losses against average TVL.
Base's 2025 ratio is heavily influenced by Balancer V2 full attribution. Stripping out that event, standalone losses sit around $23M, implying roughly 0.6%. OP Mainnet's 2025 figure is similarly distorted by Balancer V2 full attribution against a small TVL base. Standalone losses were approximately $1.7M, implying around 0.49%, a useful illustration of how dramatically a single hack can skew ecosystem-level hack impact.
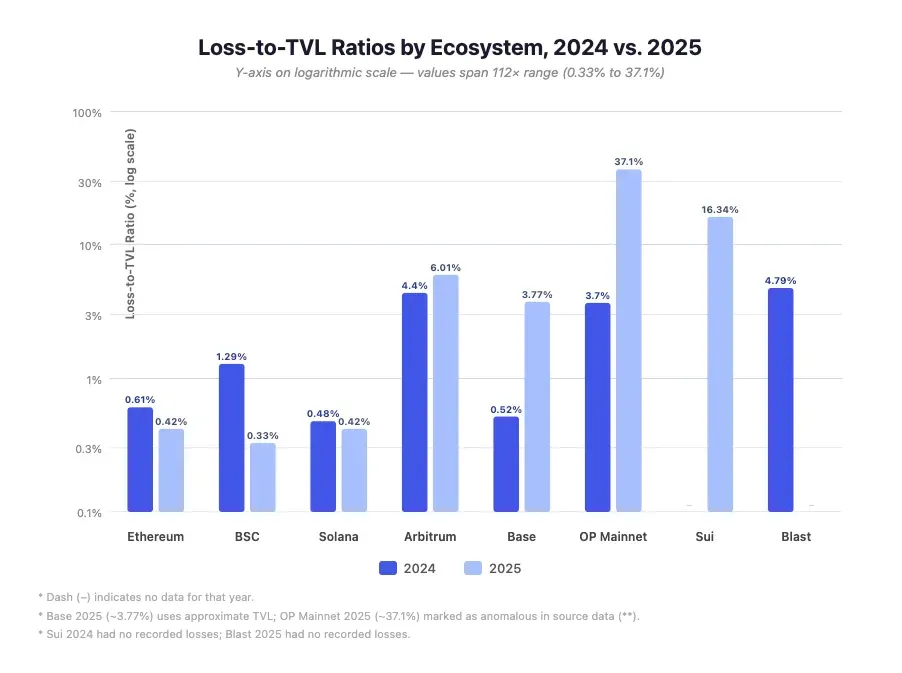
TVL figures sourced from DeFiLlama, approximate annual averages.
Normalized for TVL, the lowest-risk tier among major ecosystems in 2025 is Ethereum (~0.42%), Solana (~0.42%), and BNB Chain (~0.33%). The three largest DeFi ecosystems by TVL all sit in this group, which is direct evidence that scale and security are capable of advancing together.
A note on OP Mainnet: the figures here reflect OP Mainnet TVL only. The broader OP Superchain has substantially higher combined TVL, but rolling it up at the Superchain level would double-count Base and obscure each individual chain's risk profile.
What is driving the improvement
Ecosystems showing the strongest security gains share a common profile. Their loss-to-TVL ratios came down because TVL grew while losses stayed flat or fell, meaning defensive capacity scaled in step with adoption rather than lagging behind it. A few factors track consistently with that improvement across the full dataset.
Continuous investment in auditing and bug bounty programs produces ongoing pressure to surface vulnerabilities before attackers do. Ecosystem-level upgrades aimed at known vulnerability classes can shut down whole categories of attack outright. And the maturation of common building blocks, better oracle designs, well-tested reentrancy guards, standardized access-control patterns, removes the templated, repeatable attacks that dominated early DeFi.
The dataset also makes clear that within DeFi protocols, the exploits still landing tend to be increasingly novel and application-specific. In 2025, 89% of DeFi protocol losses came from protocol logic exploits, the toughest category to systematically defend against because each one is built around a unique flaw inside a particular application. That is what real progress looks like in onchain security: the generic attack patterns get solved, and what's left is the long tail of application-specific risk. The caveat is that this progress has not translated to the custodial layer, where the most generic attack of all, social engineering against key holders, produced the largest single loss in crypto history in the same year.
What this data means for what comes next
Taken together, the dataset is evidence that DeFi protocol security is working and getting better. Not uniformly, not in every ecosystem, and not as quickly as anyone would like, but the aggregate direction is unambiguous. Going from $2.62 billion in losses in 2022 to $534 million in 2024, DeFi protocols cut exploit-driven losses by roughly 80% in two years. The 2025 rebound to $680 million doesn't undo that progress. It reflects the growing complexity of multi-chain deployments and a handful of severe individual incidents, not a broad regression.
Outside DeFi protocols, the picture is harder to read positively. Exchange and custodial losses cleared $1.8 billion in 2025, with private key compromises accounting for the bulk of that figure. Early 2026 has already underscored that both cross-chain and operational risks remain very much active: the KelpDAO bridge exploit pulled $292 million through a single-verifier LayerZero configuration, and the Drift Protocol incident on Solana, a $285 million loss attributed to a six-month North Korean social engineering operation combining governance manipulation with oracle abuse, made clear that capable nation-state actors are now running long-term infiltration campaigns aimed directly at DeFi teams. The industry's security posture is improving in some layers and getting worse in others. The DeFi progress is real, but it is only one part of the story.
The deeper takeaway from six years of data is not really about chain-versus-chain competition. It is that DeFi's protocol layer has been learning, adapting, and building stronger defenses under continuous adversarial pressure, and the numbers show those defenses doing what they were built to do. The open question is whether the custodial layer and the cross-chain messaging layer can follow the same curve. So far, they haven't.
The data used in this analysis was sourced from DefiLlama and covers the period from 2020 through 2025. The dataset includes 460 incidents across those years, with the most complete coverage in 2021 through 2025. TVL figures referenced throughout the report are approximate annual averages, also sourced from DefiLlama.
For questions about this study or Immunefi itself, reach out at press@immunefi.com
About Immunefi
Immunefi is the leading security platform for crypto, protecting more than $180 billion in user funds, and securing protocols across the full development lifecycle, from pre-deployment through production.