What an Onchain Hack Actually Costs
Immunefi's study of onchain hack damage across 488 incidents from 2021 to 2023, covering theft, market impact, dependency effects, and organizational cost.


An Immunefi research report quantifying the full damage of an onchain hack across funds stolen, market impact, dependency effects, and organizational cost, based on 488 publicly known incidents from 2021 through 2023.
Key findings
- The average hack across 2021-2023 resulted in $16,000,824 USD stolen. The median was $1,000,000, with the largest events running roughly a hundred times the median, the signature of a power-law distribution.
- The median hacked token fell 53% over six months post-hack, with declines worsening over time rather than easing. 77.8% of hacked tokens showed sustained price suppression at the six-month mark.
- Dependency effects can be catastrophic. The Terra-Luna collapse erased $40B in Luna equity, $1B in outstanding UST, and another $1.5B in Anchor Protocol equity, alongside the rest of the Terra ecosystem, which sits 99% down and effectively defunct.
- Hacked projects lose roughly 3 months of forward momentum, including remedial security work, leadership turnover, and roadmap slippage. KyberSwap's $49M exploit forced a 50% workforce reduction.
- The Amador Hack Impact Estimate, version 1: expect $16M in direct theft, a 52% six-month token decline, indefinite price suppression for most projects, and three months of organizational damage.
Why net value stolen understates the damage
How much does an onchain hack actually cost?
Until now, the question has not been answered with any rigor, despite crypto absorbing hundreds of hacks across the past few years. Most public reporting reduces the damage to a single figure: net value stolen. That number is publishable, easy to cite, and dramatically incomplete.
The reality is that net value stolen, the standard headline figure cited after every exploit, materially undercounts the true damage. It captures only one of several ways hacks destroy value, and several of the missing categories are individually larger than the headline theft. The most under-recognized contributors to total hack damage among non-security practitioners:
- Market impact: the damage to publicly traded token (or hypothetically equity) prices triggered by a hack, often persisting well past the incident itself. This component is far less discussed than initial theft figures, and even practiced security teams tend to under-weight it.
- Dependency impacts: second-order damage to other assets and systems caused by the original event. There are three subcategories. Platform dependency is when the underlying blockchain or core infrastructure fails in a way that compromises everything built on it. Financial dependency is the cascading impact on assets linked to the hacked one, the way Luna's price collapse vaporized the Terra stablecoin. Reputational impact is the long-tail drag on user growth and adoption that follows a perceived loss of security at the ecosystem level, as has been observed on BNB Chain.
- Talent and organizational impact: the harder-to-measure damage that takes the form of lost time, lost personnel, and lost roadmap progress during the post-hack response and recovery period. For a small startup team, the months absorbed by recovery alone are always expensive and sometimes terminal.
In short: the typical hack does significantly more damage than the headline theft number suggests.
The sections that follow estimate each impact category for the average hack, using historical medians where the data supports it, or experience-informed estimates where it doesn't.
Impact from funds stolen
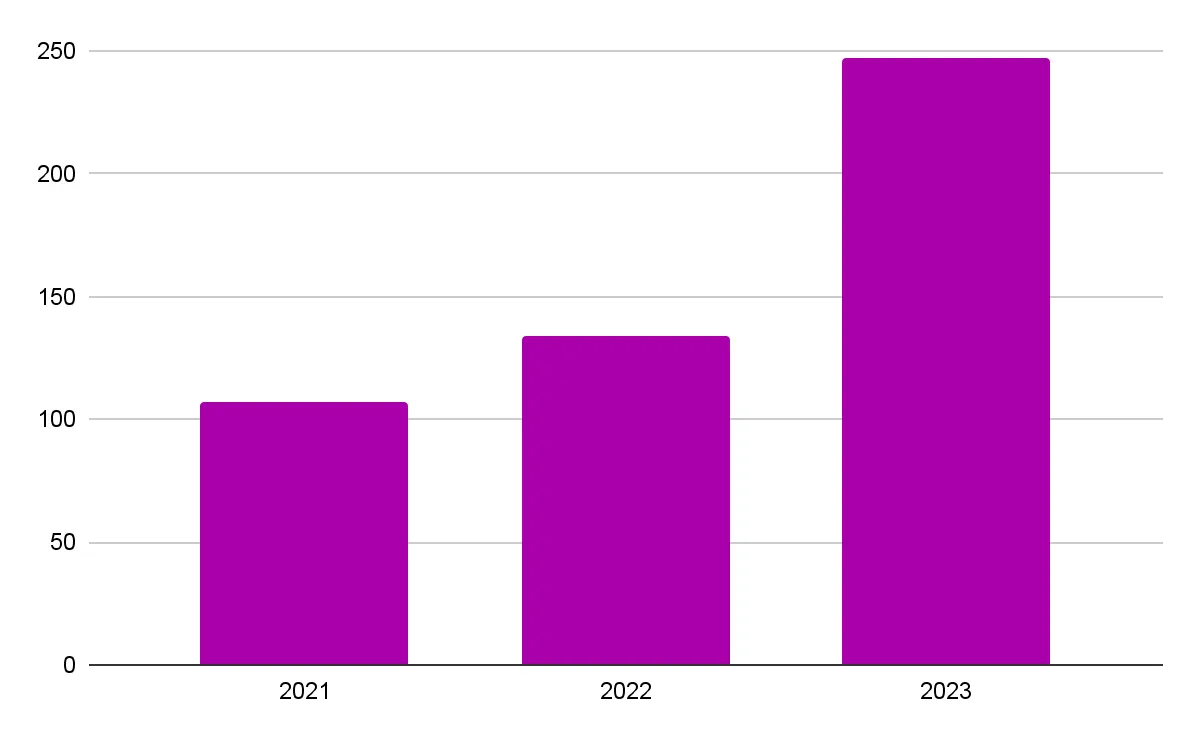
The dataset covers 107 hacks in 2021, 134 in 2022, and 247 in 2023, for a total of 488 publicly known incidents from 2021 through 2023.
These incidents affected $2,334,863,067 USD in 2021, $3,773,906,837 in 2022, and $1,699,632,321 in 2023, totaling $7,808,402,225 in funds impacted across the three-year window.
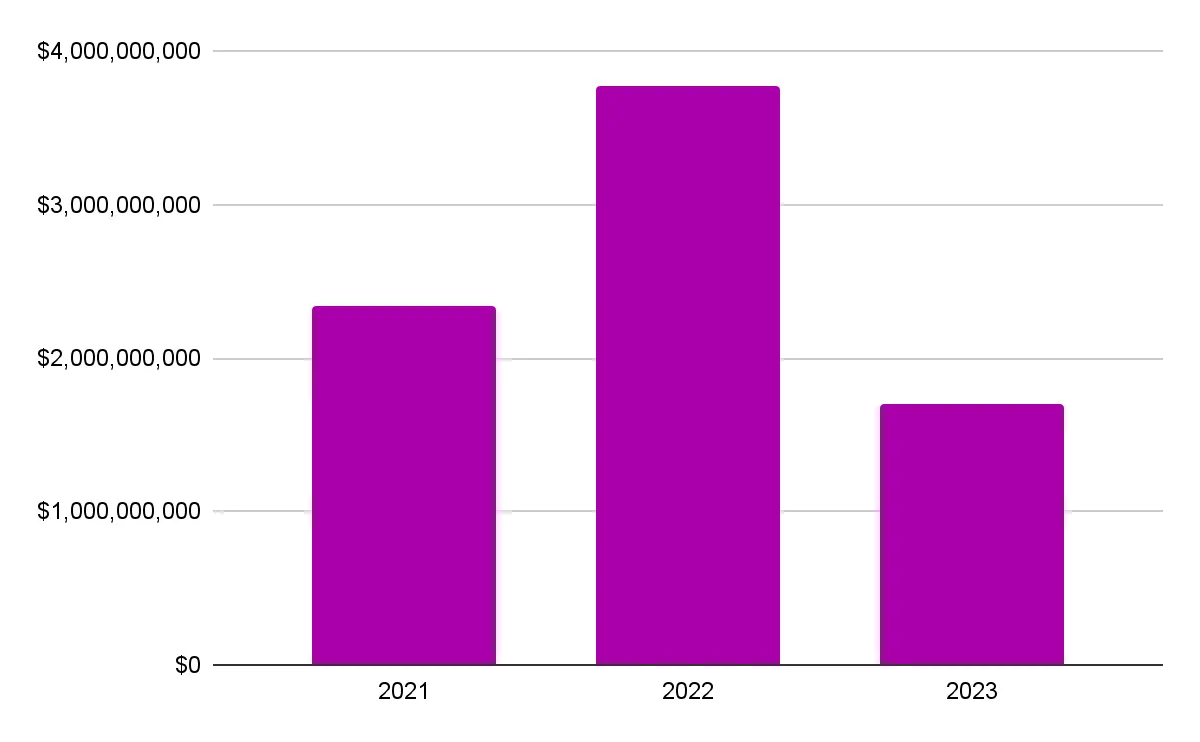
"Funds impacted" refers to assets hacked, stolen, or otherwise lost. It excludes amounts returned or recovered by whitehats, investigators, or law enforcement.
Running the numbers across the full 2021-2023 dataset:
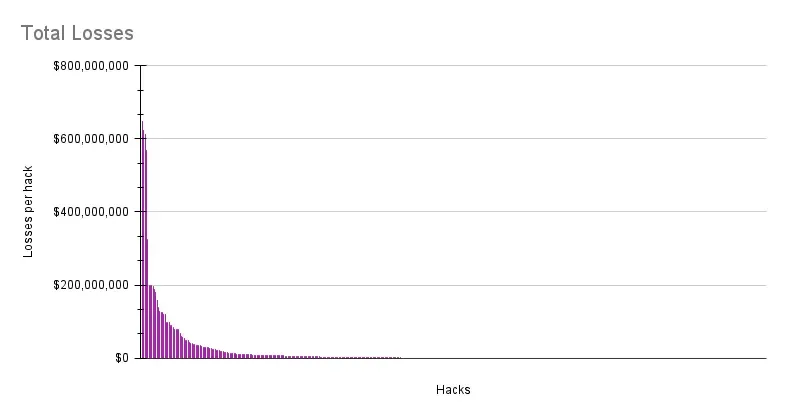
- The average hack resulted in $16,000,824 USD in stolen funds.
- The median hack resulted in $1,000,000 USD in stolen funds.
- The distribution follows a power law. Most hacks are small. The largest ones, when they hit, are roughly 100x larger than the median.
Market impact
Market impact has historically been one of the most challenging categories to quantify. Immunefi published the first systematic look at it, a 2022 report covering 63 hacks that found an average underlying token price drop of 13% two days after a hack and 19.5% five days after a hack.
To extend that analysis, Immunefi expanded the dataset to cover as many 2021, 2022, and 2023 hacks as evidence could be assembled for. The expanded analysis uses median rather than average price movements, since the median is a more predictable indicator across a distribution with rare and severe outliers.
The expanded dataset covers 176 hacks. The results are striking.
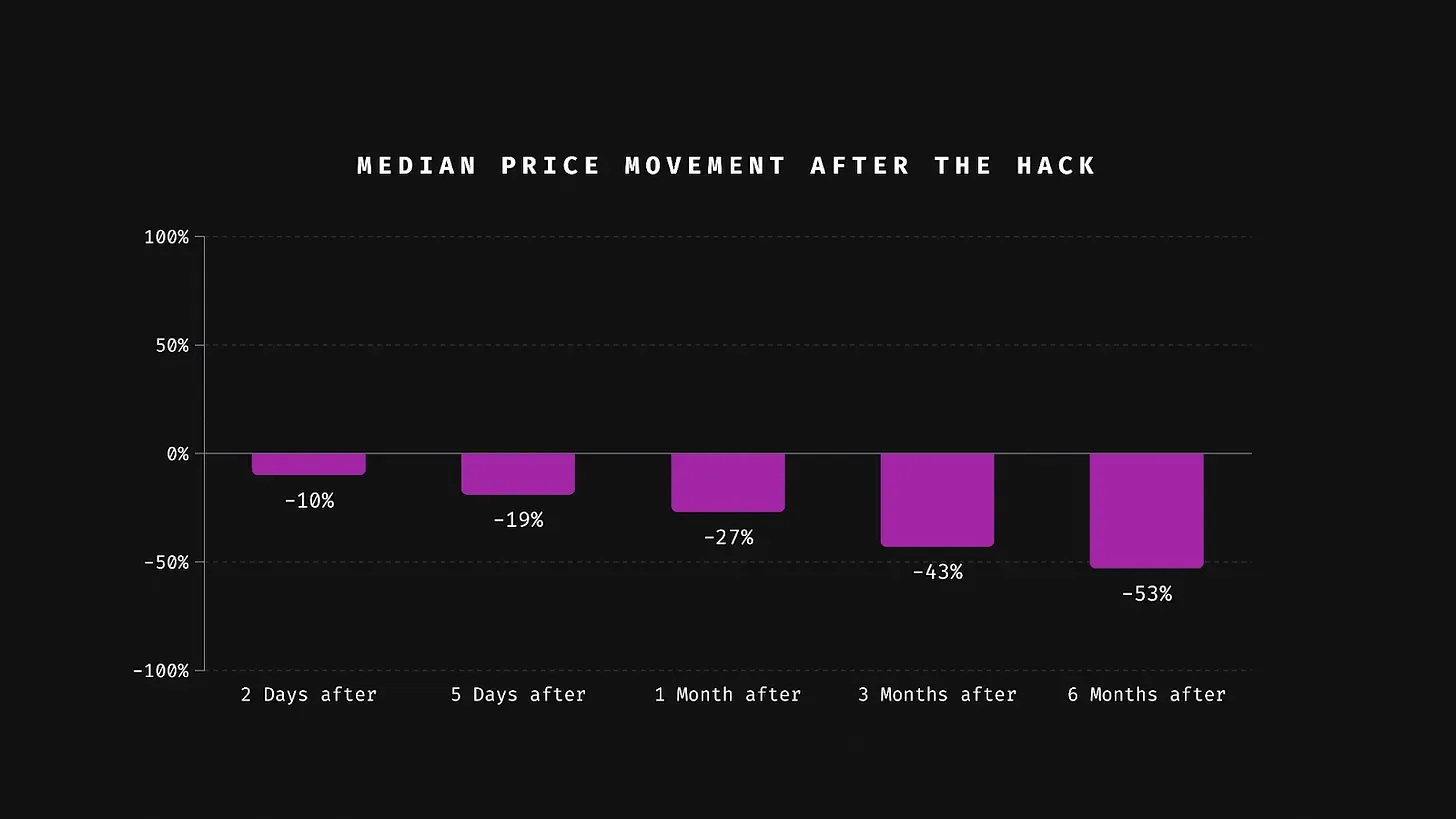
The dataset shows median price declines and sustained post-hack price suppression of:
- -10% two days after the hack
- -19% five days after the hack
- -27% one month after the hack
- -43% three months after the hack
- -53% six months after the hack
Looking at the severe end of the distribution, the picture is even worse. Three months post-hack, 32% of hacked tokens had declined more than 50%, and 11% had declined more than 90%. Six months post-hack, 35% of hacked projects were still in sustained declines exceeding 50%, and 16% had fallen more than 90%.
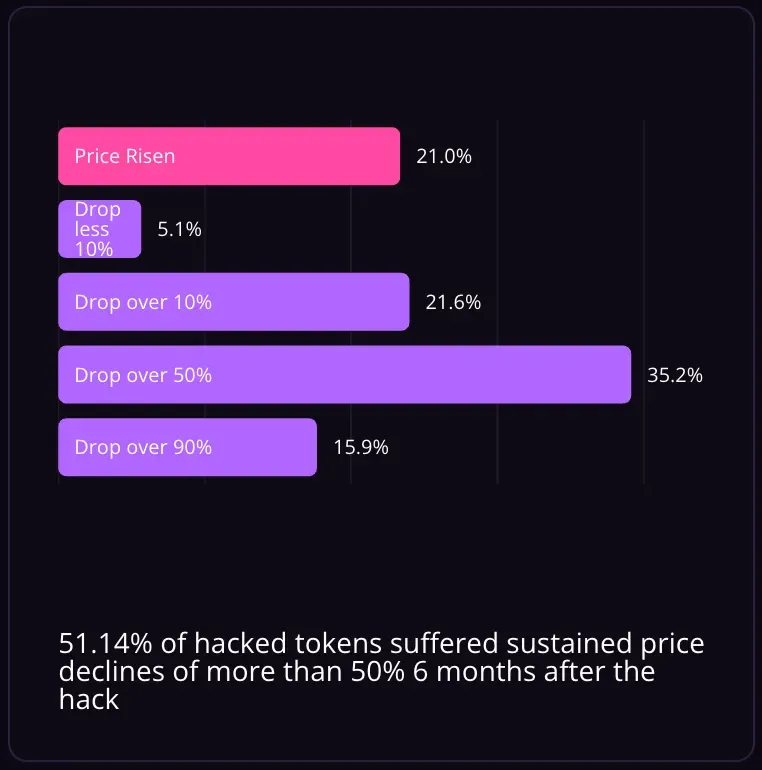
Two findings stand out. First, the power-law distribution that shows up in raw theft figures also applies to market damage: a single severe hack can be fatal to a token's price. Second, hack impact does not ease with time. It intensifies. The market keeps re-pricing for at least six months after the incident.
It is likely that market impact continues to worsen past the six-month mark, but with the dataset covering only three years, full validation of that hypothesis has to wait until the 2024 numbers are fully tabulated.
A caveat: the analysis cannot fully isolate hack-driven damage from broader market conditions. Many factors can push token prices down, including ones outside the scope of this study. Correlation with macro market conditions is the most obvious confounder. That said, the magnitude and consistency of the declines are severe enough to suggest that hack-driven damage is the primary force at work, which is the position the analysis takes.
Synthesizing the data: the typical hack causes a median market impact of approximately -19% over the first five days, intensifying to -53% over the following six months (and likely persisting indefinitely past that point), with a 16% probability that the damage exceeds 90% of the project's market capitalization.
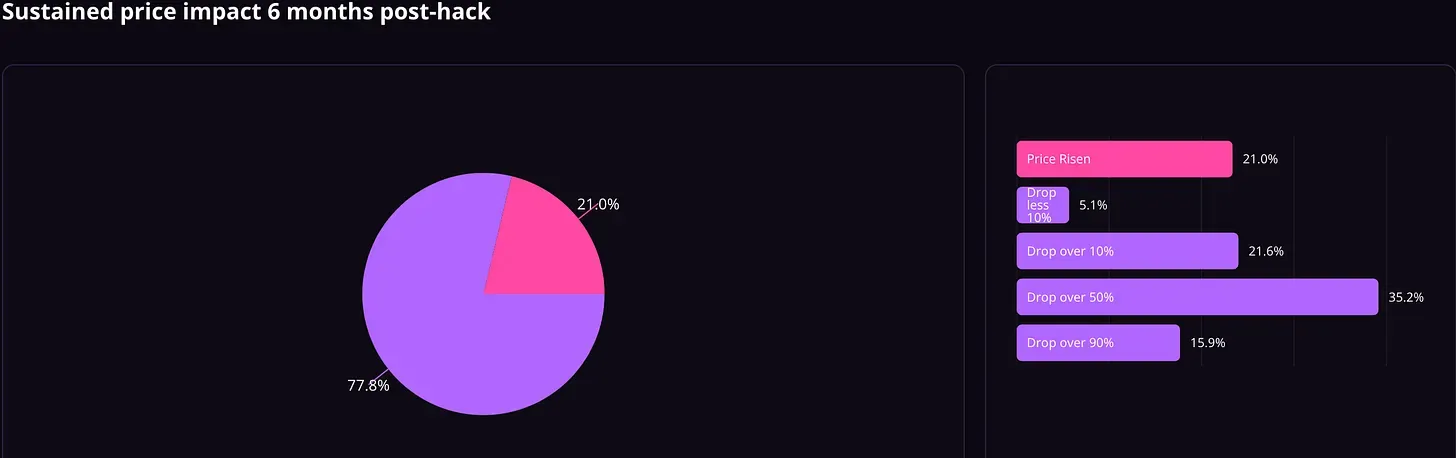
The implication is clear: market impact can be devastating.
Most token projects rely on their liquid tokens as treasury reserves and growth fuel. That is why security teams treat market impact as critical rather than incidental. Even when a hack itself does not kill a project, sustained market damage often does.
Dependency impact (second-order effects)
The most under-appreciated hack damage category is dependency impact, sometimes called second-order impact. It captures the cascade of damage triggered downstream of the original event.
Two illustrative subcategories:
- Platform-dependent impact is damage caused by the underlying platform going down (for example, a blockchain denial-of-service attack disrupting the money markets and perpetuals that operate on top of it), which can devastate every application built on top of the affected platform. Despite the obvious commonality (crypto has many platforms), limited integration between the onchain and offchain economies has so far kept incidence of this category low. Blockchains have also proven remarkably resilient. As onchain and offchain systems integrate more deeply, this category should be expected to grow more common and more severe.
- Financial dependency impact captures second-order damage to assets that are linked to the hacked one. Categories particularly exposed include stablecoins (such as MakerDAO and CDP liquidations), liquid staking tokens (such as LIDO and Rocketpool), derivatives protocols (such as Pendle), and effectively any token paired in liquidity pools. It is among the more difficult categories to measure because the impact often goes unnoticed; almost any token theft creates downstream dependency on related tokens.
The defining example of dependency impact is Terra-Luna. A coordinated financial attack on the stablecoin's underlying equity token broke the peg and set off a downward spiral the system never recovered from. The Terra-Luna collapse erased not only the $40 billion USD held in Luna equity, but also the $1 billion in outstanding UST stablecoin, alongside the value held in Terra-Luna-dependent DeFi (including the $1.5 billion in Anchor Protocol equity) and countless other Terra-based protocols. The damage to the Terra ecosystem was effectively total. The ecosystem trades 99% down today and is functionally defunct.
Research on the true incidence of dependency impacts is ongoing. Because that work is still in progress, no dependency-impact estimate is included in the Hack Impact Estimate below. The findings will be published and the estimate updated once the analysis is complete. Tentatively, dependency impacts appear to be significantly more severe than the public conversation around them suggests.
Talent and organizational impact
Talent and organizational impact typically takes two forms: loss of personnel and unplanned operational change.
The personnel loss generally hits security leadership first. The departure can be for cause, mutually agreed (a hack on one's own watch is profoundly demoralizing), or some combination. Hacked projects often lose their security leader, and the loss tends to happen prematurely, since replacement typically requires 1.5 to 4 months to find an effective hire. That is dead time for the project.
Compounding the staffing problem, hiring new security leadership is harder after a hack. The event itself signals organizational weakness to candidates evaluating the opportunity.
The second category, unplanned operational and procedural change, is almost always security-oriented. Useful work, but it pulls focus and engineering resources from the core product. Growth slows while security catches up.
A hack also tends to freeze the whole team in a state of shock that outlasts the immediate incident. Organizations typically commit at least two weeks to damage survey and damage control, followed by another two to three months on remedial security work, which suddenly outranks every other item on every team's roadmap. Core product progress gets deprioritized accordingly.
The above are the better outcomes. Talent damage can be considerably more severe when it cuts into a project's financial runway. KyberSwap is a clear example: after a $49M exploit in November 2023, the team chose to reimburse users, which forced a 50% workforce reduction, the suspension of liquidity protocol initiatives, and the shelving of the KyberAI project. The 10% bounty KyberSwap offered the attacker did not change the outcome.
These dynamics resist tidy quantification, so they are presented as a qualitative summary rather than a single number: a hacked project should expect to burn approximately three months on remedial security work, lose three months of progress on the core product roadmap and objectives, lose its current security leader, and replace that leader roughly three months later. Effectively, three months of organizational effort vanishes. That is real damage for any startup, though it is usually not fatal on its own.
So, what is the cost of an onchain hack?
Bringing the pieces together, the data supports a structured estimate, ordered by severity:
- The average hack steals approximately $16,000,000 USD at the moment of exploitation.
- The median hack drives a 52% market cap decline in the underlying token over six months. 79% of hacked projects continue to experience price depression at the six-month mark, with the eventual duration of hack-induced market impact unknown and possibly indefinite.
- The median hack does not create dependency impacts of either a financial or platform nature. When such impacts do occur, however, they tend to be catastrophic, risking destruction of every asset dependent on the affected platform. In critical bug reports involving dependency impact, the typical maximum potential damage is the total extractable value across the platform itself.
- The median hack costs approximately three months of lost time and effort across remedial security work, roadmap slippage, team churn and replacement, loss of the current security leader, and the anxiety overhead of trying to ensure it does not happen again.
The Amador Hack Impact Estimate
The data above supports a straightforward rule for estimating the real cost of an onchain hack. A protocol that gets hacked should expect:
- Value stolen of approximately $16,000,824 USD
- Token market cap suppression of 52%, persisting at least six months and likely never fully recovering (77.8% of hacked tokens show sustained price suppression at the six-month mark)
- Three months of lost organizational time and effort spent on recovery and rebuilding
A real-world case that tracks the estimate closely: the Indexed Finance hack of October 14, 2021, in which $16 million USD was stolen. The token had a market cap of $11 million at the time of the hack and $3.8 million six months later, a clear pattern of sustained post-hack suppression. The team never fully recovered, and Indexed Finance was effectively dead by mid-2022. The estimate appears to predict hack damage reliably.
For projects whose product is itself a platform (an L1, L2, or financial primitives protocol), the typical hack severity profile is total: the protocol and its dependents are at risk of being wiped out entirely.
Concluding thoughts
A hack is the beginning of the damage, not the end. The dollars lost at the moment of the exploit anticipate larger losses driven by market impact and dependency effects, alongside many months of recovery time spent rebuilding the team and the operations behind the project.
There is no shortcut around these problems. The only path forward is sustained investment in onchain security and continuous hardening across the full industry.
Bug bounties are, by some distance, the most quantifiably proven of those measures, with documented impact on preventing hacks and hack damage at scale. Beyond bounties, the industry needs more rigorous code review, stronger security standards, and continued progress on automated security tooling. Hardening across the stack is what actually prevents hacks.
That is what Immunefi is building: security at every layer of the onchain stack, with the aim of making hacks rare rather than routine.
Note: this report represents Immunefi's original 2021-2023 hack impact study. For the most recent data and an updated version of the Amador Hack Impact Estimate, see Immunefi's What an Onchain Hack Actually Costs: 2024-2025 Update.
For questions about this study or Immunefi itself, reach out at press@immunefi.com
About Immunefi
Immunefi is the leading security platform for crypto, protecting more than $180 billion in user funds, and securing protocols across the full development lifecycle, from pre-deployment through production.